Q. 45 The measured trans conductance ![]() of an NMOS transistor operating in the linear region is plotted against the gate voltage
of an NMOS transistor operating in the linear region is plotted against the gate voltage ![]() at a constant drain voltage
at a constant drain voltage ![]() Which of the following figures represents the expected dependence of
Which of the following figures represents the expected dependence of ![]() on
on ![]() ?
?
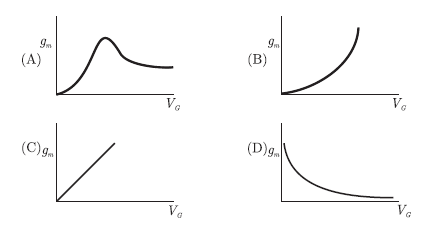
Answer: C
Explanation:


