Q 26. The figure below shows a graph, which qualitatively relates cutting speed and cost per piece produced.
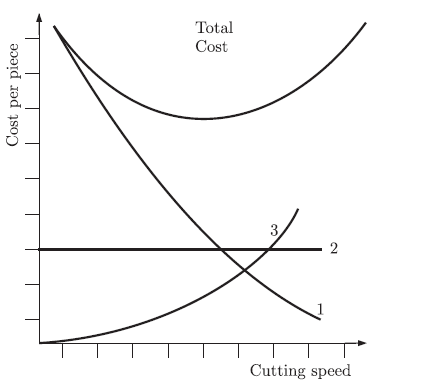
The three curves, 1, 2 and 3 respectively represent
(A) machining cost, non-productive cost, tool changing cost
(B) non-productive cost, machining cost, tool changing cost
(C) tool changing cost, machining cost, non-productive cost
(D) tool changing cost, non-productive cost, machining cost
Answer: (A)
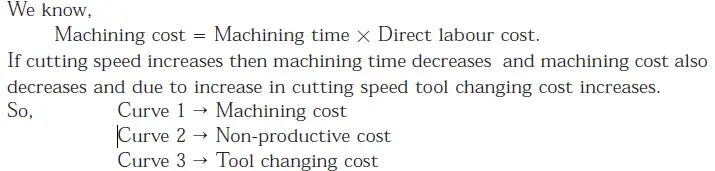
Explanation:


