Q.6 The Venn diagram shows the preference of the student population for leisure activities.
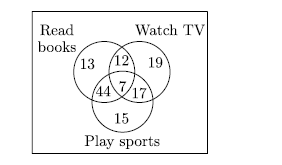 From the data given, the number of students who like to read books or play sports is _____
(A) 44
(B) 51
(C) 79
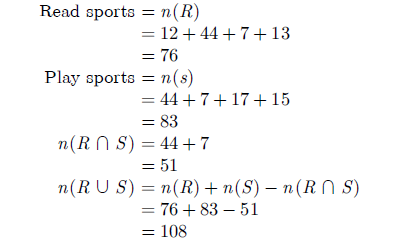
(D) 108
Answer: (D)
Explanation:
Q.6 The Venn diagram shows the preference of the student population for leisure activities.
From the data given, the number of students who like to read books or play sports is _____
(A) 44
(B) 51
(C) 79
(D) 108
Answer: (D)
Explanation:


